Investors
Performance summary
| Indicator | Change | 2017 | 2016* | 2015* |
|---|---|---|---|---|
| Headline earnings per share (cents) | 8%  |
53.4 | 58.1 | 31.9 |
| Normalised headline earnings per share (cents) | 4%  |
59.7 | 62.2 | 59.4 |
| Operating income from continuing operations (Rm)** | 1%  |
3 435 | 3 395 | 3 276 |
| Profit from operations (Rm) | 3%  |
933 | 905 | 892 |
| Net profit for the year (Rm) | 80%  |
1 574 | 874 | 359 |
| Normalised profit after tax (Rm)*** | 4%  |
704 | 680 | 485 |
| Final dividend (cents) | 5%  |
23 | 22 | 12 |
| Average AuA and AuM (Rbn) | 2%  |
345 | 339 | 322 |
| * | Restated for discounted operations. |
| ** | Operating income represents revenue net of direct expenses. |
| *** | Excluding discontinued operations. |
Highlights
- 1.2% growth in operating income
- Disciplined expense management, with costs growing 0.5%
- 3.1% growth in profit from operations with improved margin of 27.2% (up from 26.7% in 2016)
- Normalised profits excluding discontinued operations increased 3.5%
- Good cash conversion resulting in a 23 cents final dividend
- Special dividend of 23 cents
- Core business growth in financial services
- Retail business gaining traction
Challenges
- Weak economic and business environment in South Africa and the rest of Africa
- Loss of significant client (BPOPF) in Africa
- Poor group risk underwriting results
- New business growth behind market
- Unemployment driving significant cash outflows
Our approach
The Alexander Forbes board takes overall responsibility for investor relationships, ensuring investors have a sound understanding of the group’s value. Management and the chairman of the board interact with investors through a variety of channels including webcasts, analyst briefings and one-on-one meetings in order to provide clear information on our half- and full-year results.
The group maintains an investor relations function that reports to the group CFO. Our formal reporting to investors is in line with best-practice governance and regulatory requirements and includes our integrated reports, annual financial statements, results announcements and our annual general meeting.
In order to improve the access and understanding of our group in the investor community, the group held an investor day on 13 June 2017.
The presentations and webcast of our investor day held are available online at
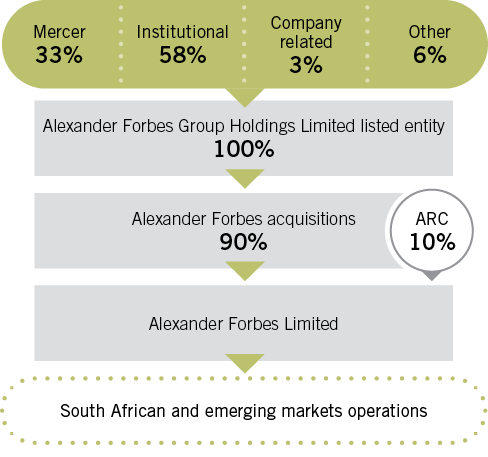
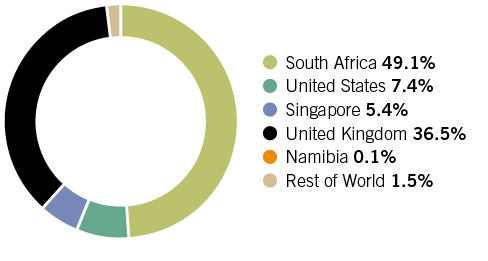
On 20 January 2017 our shareholders approved a transaction introducing African Rainbow Capital (ARC), a wholly-owned subsidiary of Ubuntu-Botho Investments Proprietary Limited, as an empowerment shareholder, with a 10% shareholding in wholly-owned subsidiary Alexander Forbes Limited (AFL). Our three most significant shareholders at the Alexander Forbes Group Holdings level are Mercer Africa Limited, Liberty Life and the Government Employees Pension Fund. Of the institutional shareholders, 73% are South African.
| Institutional shares by geography |
|---|
| African Rainbow Capital (ARC) – our new shareholder and strategic partner |
|---|
|
ARC invested in Alexander Forbes’s African operations by acquiring 10% of wholly-owned subsidiary Alexander Forbes Limited (AFL) for a total cash consideration of R753 million. Johan van Zyl, the co-CEO of ARC described the transaction as a landmark investment by ARC which has a 10- to 20-year vision to build a South African base and expand into the rest of Africa. ‘For us, investing in Alexander Forbes is key to executing on that vision since the group is a recognised market leader in South Africa and selected markets in Africa.’ We believe that having ARC as a shareholder provides strategic advantage in the South African context and will enhance the growth prospects of the group through deal flow, collaborative development and transformation in the South African financial services industry. |
More information on our shareholding structure is available in the annual financial statements at
www.alexanderforbes.co.za/investor-relations/financial-statements
| Key risks | Mitigating actions |
|---|---|
| South African economic recovery | We believe that the long-term growth prospects for South Africa remain positive. As such it is important to manage through the period of low economic growth. We continue to manage costs aggressively while investing in efficiency. |
| Ongoing margin pressure | The South African financial services industry will continue to see reduced margins in line with international trends. Alexander Forbes focuses on delivering value to our clients through a better understanding of their needs and delivering services that will enhance their financial well-being. We pride ourselves in providing an appropriate selection of investments and financial services that are fit for purpose. Through scale we ensure that costs are well managed and margins are protected. |
| Achieving operational efficiency | As a financial services provider, a significant portion of our costs are personnel costs. In this context we continue to look for structural changes to enhance the productivity and efficiency of our service delivery. In this year we have concluded agreements with Sapiens to transform our host systems and enhance our ability to deliver seamless administration to our member base. This will also provide an improved digital interface for self-service and delivery. Importantly, it will provide ongoing opportunity for efficiency enhancements over the next five years and beyond. |
| Evolving regulatory environment | Global and local regulatory enhancements continue to ensure improved outcomes for the users of financial products and services as well as ensuring the financial soundness of the providers. Our customers remain the centre of our vision and mission and as such we support and remain committed to regulatory reform. |
Our performance
The group’s core trading results increased by 3.1% for the year ended 31 March 2017. This increase is a result of a 1.2% growth in operating income and 0.5% growth in operating expenses. Operating leverage of 0.7% was achieved through aggressive cost containment. We define operating leverage as the difference in growth of operating income against growth of operating expenses.
The sale of the international consulting partnership in the UK (LCP) gave rise to an extraordinary profit which is adjusted for in headline earnings. As a result the group has reported normalised earnings per share of 114.5 cents, which is 101.2% higher than the previous year and headline earnings per share of 53.4 cents, which is 8.1% lower than the previous year.
A normalised representation of the results reflects a growth in profit from continuing operations of 3.5% to R704 million. The weighted average number of shares has remained largely unchanged.
The results should be seen in the context of the sale of LCP, whose results are included for eight months of the current year as opposed to the full 12 months of the previous financial year.
| Mercer – leveraging our relationship |
|---|
|
We continue to strengthen our relationship with Mercer, the world’s largest human resources consulting firm. Marsh & McLennan Companies (MMC), through its wholly-owned subsidiary, Mercer Africa, is the largest single shareholder of Alexander Forbes since it acquired a 34% stake of the group at the time of its 2014 listing (current shareholding: 33%). We have recently launched the Alexander Forbes Mercer Investments joint venture. This co-ordinated approach to our investment solutions for our clients will greatly enhance our global portfolios as well as our local offering. Both Mercer and Alexander Forbes have dedicated resources applied to finding additional areas of collaboration which will be driven towards enhancing our customer value proposition. |
Shareholder performance measures
| 2017 | 2016 | 2015 | |||
|---|---|---|---|---|---|
| Actual | % change | Normalised | Normalised | Normalised | |
| Earnings per share (cents) | 114.5 | (4) | 59.3 | 61.9 | 59.4 |
| Headline earnings per share (cents) | 53.4 | (4) | 59.7 | 62.2 | 59.4 |
| Return on equity (%) | 22.9 | (11) | 12.1 | 13.6 | 13.8 |
| Return on capital employed (%) | 23.9 | (13) | 15.3 | 17.6 | 17.9 |
Strategic resource allocation
In line with our strategy and Ambition 2022 we have further enhanced our operating structure to ensure that there are clear mandates for each of the business divisions and that these divisions are resourced appropriately to achieve their goals. Importantly, financial reporting, measurement criteria and targets over the next five years have been defined in line with the new structure.
Funding structure and regulatory capital
In the context of the available cash on the group’s balance sheet (R2.3 billion), the board has approved a long-term capital strategy that incorporates the group’s ability to generate strong cash flows in the future. It is anticipated that, in the next five years, the period over which we have defined our ambition, the group will be required to allocate an estimated R7 billion in cash generated. The capital allocation process aims to balance the demands of capital required within the business against capital return to shareholders. Our target capital allocation over the next five-year period to 2022 is anticipated as follows: dividends, acquisitions, investments, special dividends and buy-backs.
Group capital allocation considerations
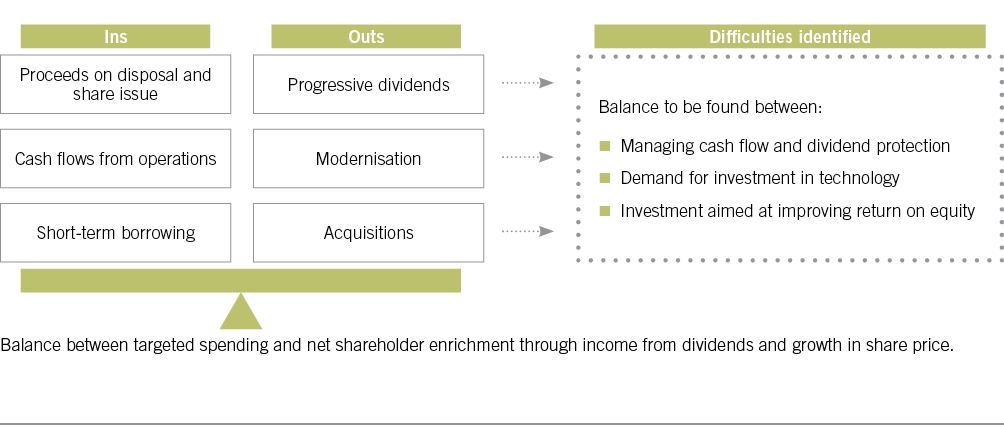
Group target capital allocation to 2022

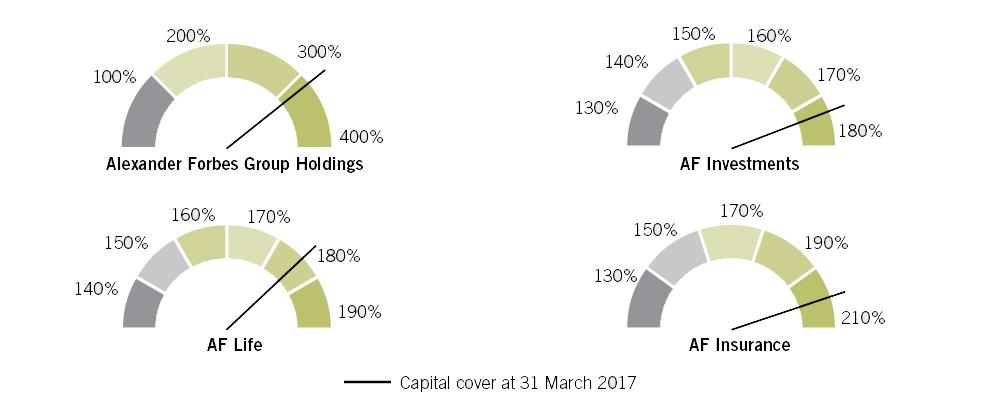
The group’s capital structure is managed within regulatory bounds, specifically in anticipation of requirements expected to be legislated under SAM. These standards impose more stringent requirements on long-term and short-term insurers, with additional regulatory requirements on the ultimate holding company of insurance groups. Alexander Forbes has positioned its capital to meet these requirements in advance of the legislation which is expected to be promulgated during 2018. The capital cover of the group and insurance entities as at 31 March 2017 is reflected below.
Regulatory capital for the group and insurance entities
The group maintains a R1 billion unsecured revolving credit facility that is renewable annually. The facility provides limited financial leverage and the group continues to manage its capital structure as efficiently as possible while ensuring compliance with the regulatory requirements.
Quality and sustainability of revenues and profits
Approximately 77% of Alexander Forbes’s revenue base is considered recurring or predictable in nature. The recurring fee income comprises asset-based income, fees for services rendered in month administration (either on a fee-per-member or percentage of salary contribution), consulting fees and commission income.
Operating income and profit
Group revenue by type

Maintaining and growing our market-leading institutional business
The institutional clients division delivered R1 920 million of operating income, which is 0.6% higher than the prior year. Business units within this division have been adjusted to align with our strategy and include:
- Consulting – actuarial consulting, healthcare actuarial and consulting
- Retirements – fund administration to standalone and umbrella retirement funds, beneficiary trust consulting and administration
- Investments – investment services including a range of investment portfolios, advice-led solutions and alternative investments
- Group risk – long-term life insurance
Growth in operating income was impacted by the macroeconomic and political environment in South Africa as well as below-expectation performance across group risk underwriting. The overall increase in expenses was contained at 0.5% as a direct result of improved efforts around cost containment and operational efficiency. As a result profit from operations increased by 0.6% to R465 million for the year ended 31 March 2017.
Institutional clients
| 2017 | % | CAGR | ||||
|---|---|---|---|---|---|---|
| Rm | Actual | growth | 2016 | 2015 | 2014 | % |
| Operating income | ||||||
| Consulting | 802 | (2.0) | 818 | 793 | 757 | 1.9 |
| Retirements | 421 | 12.3 | 375 | 351 | 322 | 9.3 |
| Investments | 640 | (0.2) | 641 | 727 | 675 | (1.8) |
| Group risk | 57 | (24.0) | 75 | 84 | 69 | (6.2) |
| Total | 1 920 | 0.6 | 1 909 | 1 955 | 1 823 | 1.7 |
| Operating profit | ||||||
| Consulting | 74 | (8.6) | 81 | 82 | 78 | (1.7) |
| Retirements | 100 | 26.6 | 79 | 72 | 89 | 4.0 |
| Investments | 276 | – | 277 | 349 | 317 | (4.5) |
| Group risk | 15 | (40.0) | 25 | 31 | 27 | (17.8) |
| Total | 465 | 0.6 | 462 | 534 | 511 | (3.1) |
| Margin (%) | ||||||
| Consulting | 9.2 | (6.8) | 9.9 | 10.3 | 10.3 | |
| Retirements | 23.8 | 12.8 | 21.1 | 20.5 | 27.6 | |
| Investments | 43.1 | – | 43.2 | 48.0 | 47.0 | |
| Group risk | 26.3 | (21.1) | 33.3 | 36.9 | 39.1 | |
| Total | 24.2 | 0.1 | 24.2 | 27.3 | 28.0 |
Growing retail clients
The wealth and investments segment of the retail clients business is focused on generating revenue through the offering of financial advice, as well as the administration and management of investments. This segment incorporates financial planning consultants (FPCs), AF Individual Client Administration (AFICA), AF Preservation Fund and the retail assets under management in AF Investments.
Growth in operating income of this segment showed an increase of 5.1% to R797 million for the year ended 31 March 2017. Of this income 64% is asset-based income and a further 36% relates to consulting and advisory fees also linked to asset values.
The retail insurance businesses comprise AF Insurance, which provides short-term insurance solutions to individuals and the AF Life individual insurance business. The growth of short-term insurance was impacted by both the economic environment as well as claims experience. Gross written premium increased by 8.0% to R1.5 billion for the year ended 31 March 2017. The business continues to grow ahead of competitors, based on an enhanced product offering and good service levels.
Retail clients
| 2017 | % | CAGR | ||||
|---|---|---|---|---|---|---|
| Rm | Actual | growth | 2016 | 2015 | 2014 | % |
| Operating income | ||||||
| Wealth and investments | 797 | 5.1 | 758 | 673 | 569 | 11.9 |
| Retail insurance | 477 | 4.1 | 458 | 416 | 360 | 9.8 |
| Total | 1 274 | 4.8 | 1 216 | 1 089 | 929 | 11.1 |
| Operating profit | ||||||
| Wealth and investments | 378 | 14.9 | 329 | 271 | 233 | 17.5 |
| Retail insurance | 88 | (4.3) | 92 | 85 | 77 | 4.6 |
| Total | 466 | 10.7 | 421 | 356 | 310 | 14.6 |
| Margin (%) | ||||||
| Wealth and investments | 47.4 | 9.3 | 43.4 | 40.3 | 40.9 | |
| Retail insurance | 18.4 | (8.2) | 20.1 | 20.4 | 21.4 | |
| Total | 36.6 | 5.6 | 34.6 | 32.7 | 33.4 |
Emerging markets
Alexander Forbes Emerging Markets (AFEM) currently operates in five countries across Africa: Namibia, Botswana, Zambia, Uganda and Nigeria. Economic growth in all of these markets remained well below the longer-term potential. The impact of global economic developments in the current financial year contributed to rising risk aversion, increasing pressure on the economies, currencies and investment markets of our emerging markets countries.
With the Government of Botswana insourcing its Public Officers Pension Fund (BPOPF) in 2016, AFEM lost one of its largest clients and net revenue consequently declined by 10.7% for the year. Excluding the BPOPF impact, net revenue grew at 2.0%. Downsizing and redundancy costs in Botswana contributed to the overall cost growth of 2.0%. Members under administration naturally decreased as a result of the above-mentioned client loss in Botswana. Further measures to improve the operating leverage in Botswana included reducing overheads alongside a buildout of retail consumer lines to enhance revenue. We expect to realise the impact of these initiatives in the next financial year.
AFEM’s total profit from ongoing operations declined by 51% to R32 million for the year ended 31 March 2017.
Emerging markets
| 2017 | % | CAGR | ||||
|---|---|---|---|---|---|---|
| Rm | Actual | growth | 2016 | 2015 | 2014 | % |
| Operating income | 241 | (10.7) | 270 | 232 | 200 | 6.4 |
| Operating profit | 32 | (50.8) | 65 | 55 | 39 | (6.4) |
| Margin (%) | 13.3 | (47.4) | 24.1 | 23.7 | 19.5 |
Controlling costs
The management and board of Alexander Forbes have been focused on managing costs in the business over the past few years. The intensity of cost and operational efficiency has been a stronger focus in the past year as a key part of the strategy to build a more resilient business model and address structural and expense efficiencies. A continued drive to deliver positive operating leverage across all business units has been put in place.
Expenses
| 2017 | % | CAGR | ||||
|---|---|---|---|---|---|---|
| Rm | Actual | growth | 2016 | 2015 | 2014 | % |
| Employee costs | 1 428 | (3.8) | 1 484 | 1 428 | 1 249 | 3.4 |
| Payroll costs | 1 257 | 1.9 | 1 234 | 1 158 | 1 037 | |
| Bonus and profit share | 171 | (31.6) | 250 | 270 | 212 | |
| Share scheme costs | 16 | (27.3) | 22 | 16 | – | |
| Premises (excluding IFRS adjustment) | 269 | 4.3 | 258 | 245 | 223 | 4.8 |
| IT costs | 267 | 24.8 | 214 | 202 | 177 | 10.8 |
| Professional fees | 103 | 8.4 | 95 | 74 | 84 | 5.2 |
| Insurance costs | 68 | (1.4) | 69 | 75 | 77 | (3.1) |
| Subtotal | 2 151 | 0.4 | 2 142 | 2 040 | 1 810 | 4.4 |
| % of total costs | 86% | 86% | 86% | 85% | ||
| Other costs | 351 | 348 | 344 | 329 | 1.6 | |
| Total operating expenses | 2 502 | 0.5 | 2 490 | 2 384 | 2 139 | 4.0 |
Maintaining investor confidence
It is clear that since listing in July 2014, the group has underperformed when compared with the initial investment thesis and delivery of shareholder return. The contributing factors to this underperformance include factors that are outside of management’s control (such as the muted South African economic conditions), but also those that are within management’s control (such as slower-than-expected retail penetration and structural cost management).
The board and executive management are clear on the path forward under a refreshed strategy for the group alongside a crystal clear investment thesis of ‘cash flow plus growth’. In delivering on the refreshed strategy under Ambition 2022, the group is focused on:
- Leveraging its market-leading institutional businesses to drive retail and emerging market growth
- Delivering positive operating leverage with a focus on maintaining cost per member per month by a least 2% below inflation and improving structural and operating efficiency
- Building a strong ecosystem to drive growth with effective strategic partnerships with Mercer and African Rainbow Capital
| Modernisation programme |
|---|
|
On 7 April 2017 the group announced that a significant software development agreement had been concluded with Sapiens. Under this agreement Sapiens will provide a wide range of offerings both in the end-to-end host administration and key components of the Sapiens Digital Suite. This project, which is due to be developed in phases over the next four years, will power Alexander Forbes’s client proposition and enhance its digital capability. The financial commitment relating to this contract amounts to $51 million over the next four financial years. The costs of development will be capitalised and depreciated over the expected useful life of the system. The single host system will allow for rationalisation of our current disparate systems and is expected to deliver a net reduction in costs over the next five years. |
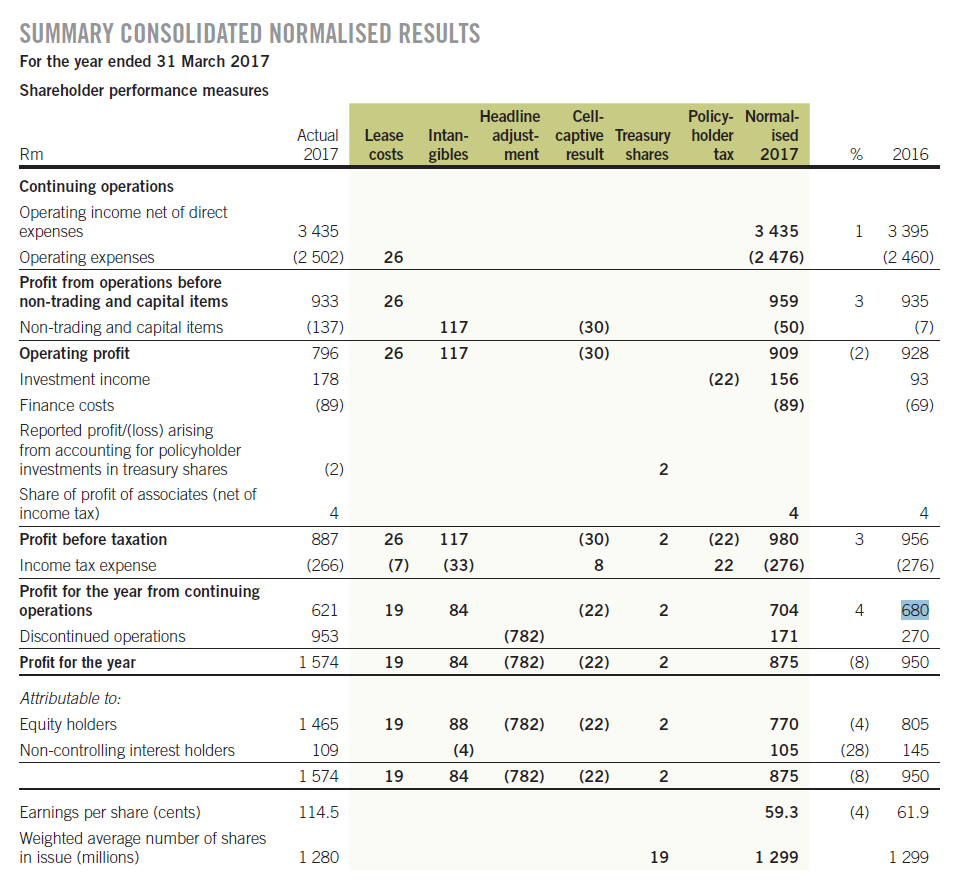
Normalised profit
The group’s normalised results are presented to reflect the basis upon which management manages the group and reflects the economic substance of the group’s performance. The adjustments between the IFRS summary consolidated income statement and the normalised results are as follows:
- Accounting for property lease – The accounting treatment for long-term leases, particularly at the Sandton head office, continues to have a small positive impact on the operating profit growth rate while the absolute value is an expense of R26 million for the year ended 31 March 2017.
- Capitalisation of intangible assets and the related amortisation – Non-trading and capital items include the ongoing accounting amortisation of intangible assets amounting to R117 million for 2017 and R124 million in the prior financial year. The capitalisation of intangible assets and the related amortisation resulted from the required accounting treatment at the time of the private equity acquisition of the group under common control in 2007.
- Accounting for Alexander Forbes shares held in policyholder investment portfolios – In terms of IFRS as presently constituted, any Alexander Forbes shares acquired by underlying asset managers and held by the group’s multi-manager investment subsidiary for policyholders (the shares) are required to be accounted for in Alexander Forbes’s consolidated financial statements as treasury shares and results in the elimination of any fair value gains or losses made on the shares.
- Investment income and taxation payable on behalf of policyholders – The group’s tax rate compared to profits before tax appears high as a result of taxation payable on behalf of policyholders being included in this amount (refer to the investment income discussion as well as note 8 in the full financial statements available online). The normalised results exclude the policyholder tax expense and the related investment income which directly offset this tax expense.
Looking ahead
The group’s strategy, Ambition 2022, is focused on helping customers achieve a lifetime of financial well-being and security. This is delivered through a five-pillar strategy supporting the group’s vision of becoming a globally distinctive pan-African financial services leader. In summary, the strategy will:
- Leverage our market-leading institutional businesses to drive retail and emerging market growth
- Deliver positive operating leverage with a focus on maintaining cost per member per month by a least 2% below inflation and improving structural and operating efficiency
- Build a strong ecosystem to drive growth with effective strategic partnerships with Mercer and African Rainbow Capital
As part of Ambition 2022 we have defined clear financial targets which we will be working towards over the five-year period:
| Metric | Target |
|---|---|
| Annual revenue growth | 8% – 10% |
| Annual cost growth | 7% – 9% |
| Annual operating profit growth | 10% – 12% |
| Return on equity (ROE) | >14% |
| Maintain dividend cover at | 1.5 times |
The completion of two significant transactions – the sale of our share in LCP and the ARC shareholding – has provided us with capital for investments and acquisitions, which will be a key focus in the year ahead. An acquisitions subcommittee of the board has been established to oversee this process and we are considering a pipeline of potential investments.
The group has emerged as a leaner, customer-focused business that is well positioned to create substantial value for shareholders in its next growth phase as a leading financial services group in South Africa and other select emerging markets.


