Investors
Highlights
- 11% growth in operating income
- 6% growth in profit from operations
- 12% growth in profit after tax
- Continued strengthening of the regulatory capital position
- Final dividend of 22 cents, bringing the total dividend for the 12 months to 37 cents
- Core business growth in financial services
- Retail business gaining traction
- Strong growth in Africa outside of South Africa
Challenges
- Weak economic and business environment in South Africa
- Margin pressure in asset management and administration fees due to external factors
- Unemployment driving significant cash outflows
- Continuing changes in the regulatory environment
Our approach
Alexander Forbes recognises the benefit of fostering and maintaining strong relationships with its investors through effective communication. The board takes overall responsibility for investor relationships, ensuring they have a sound understanding of the group’s value. Management and the chairman of the board interact with investors through a variety of channels, including webcasts, analyst briefings and one-on-one meetings in order to provide clear and definitive guidance on our half- and full year results.
The group maintains an investor relations function that reports to the group CFO. Enhancements have been made during the year, including an upgrade to the investor relations website featuring improved share price and financial data for investors’ convenience.
Our track record of consistent public integrated reporting and engagement with investors predates our 2014 listing; we previously reported through the listed preference share investment vehicle and its associate investment in Alexander Forbes Equity Holdings.
We have adopted formal reporting of our results in line with best-practice governance and regulatory requirements. This includes our integrated reports, annual financial statements, a formal pre-closed period interaction with investors, results announcements and our annual general meeting.
Our performance
The group’s headline earnings increased 89% to R744 million for the 2016 financial year. This increase is a result of the listing and transaction costs incurred in the prior year and detailed in the related listing documents. A normalised representation of the results presented in our results announcement reflects growth in profit after tax of 12% to R950 million. The weighted average number of shares in issue increased marginally due to the timing of the listing and the related issue of shares in the prior year which resulted in the headline earnings per share increasing by 82% to 58.1 cents per share.
Stakeholder profile: Mercer LLC
Mercer, the world’s largest human resources consulting firm, is the largest single shareholder of Alexander Forbes since it acquired a 34% stake of the group at the time of its 2014 listing. Mercer operates in more than 130 countries and can therefore support Alexander Forbes’s clients currently operating outside of Africa and those planning to expand beyond the continent. Mercer also contributes strategic expertise and global perspective to the group’s operations.
|
Shareholder performance measures |
|||||
|
2016 |
2015 |
2014 |
CAGR |
||
|
Actual |
Normalised |
Normalised |
Normalised |
Normalised |
|
|
Earnings per share (cents) |
56.9 |
62.8 |
60.1 |
52.9 |
18.8 |
|
Headline earnings per share (cents) |
58.1 |
63.0 |
60.1 |
52.9 |
18.8 |
|
Return on equity (%) |
12.4 |
13.6 |
13.8 |
N/A* |
|
|
Return on capital employed (%) |
17.4 |
17.7 |
17.9 |
14.9 |
|
|
2014 return on equity not presented due to significant subsequent change in capital structure. |
|||||
In this section, we detail our performance against the key issues related to our financial performance, namely strategic resource allocation, controlling costs and maintaining investor confidence.
Strategic resource allocation
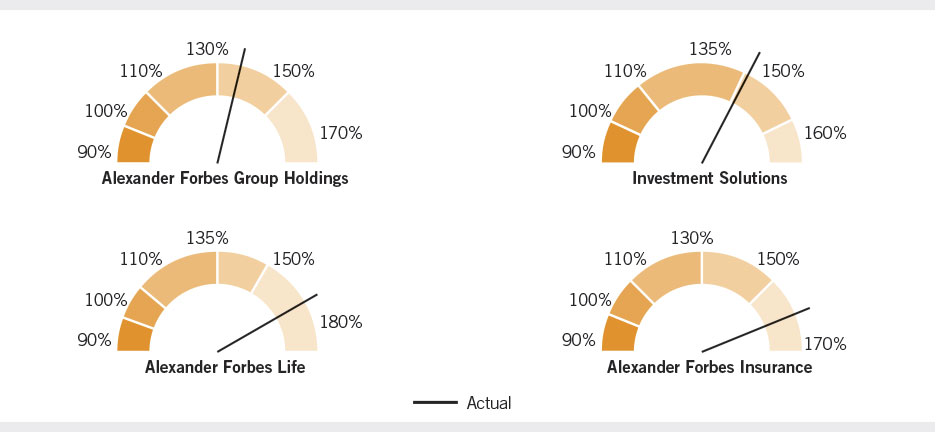
Funding structure and regulatory capital
The group’s capital structure is managed largely within regulatory bounds, specifically in anticipation of requirements expected to be legislated under SAM. These standards will impose more stringent requirements on long-term and short-term insurers, with additional regulatory requirements on the ultimate holding company of insurance groups. Alexander Forbes has positioned its capital to meet these requirements in advance of the legislation which is expected to be promulgated on 1 January 2017. The capital cover of the group and insurance entities as at 31 March 2016 is reflected below.
The group maintains an unsecured flexible revolving credit facility that is renewable annually. The facility provides limited financial leverage and the group continues to manage its capital structure as efficiently as possible while ensuring compliance with the regulatory requirements.
Quality and sustainability of revenues and profits
Recurring nature
Approximately 77% of Alexander Forbes’s revenue base is considered recurring or predictable in nature. The recurring fee income comprises asset-based income, fees for services rendered in month administration (either on a fee-per-member or percentage of salary contribution), consulting fees and commission income. Our net operating income by type is reflected below.
Revenue exposure to equity markets
A key component influencing the group’s revenue is the underlying asset base upon which fees are earned. It is therefore important that we grow assets both through new business flows and through asset performance. Fees linked to the asset base include revenue from multi-manager activities, administration fees and fees charged for financial advice. The revenue generated by fee type is shown below.
Maintaining and growing the core (institutional)
|
Operating income |
Profit from operations |
|||||
|
31 March |
Var. |
31 March |
31 March |
Var. |
31 March |
|
|
Institutional business |
||||||
|
Financial Services |
1 287 |
3 |
1 254 |
183 |
(2) |
186 |
|
Investment Solutions |
641 |
(8) |
696 |
279 |
(15) |
328 |
|
AF Insurance |
20 |
67 |
12 |
5 |
150 |
2 |
|
1 948 |
(1) |
1 962 |
467 |
(9) |
516 |
|
In 2016, the group derived credible results from the core retirement fund consulting, actuarial, and operations and administration businesses in a difficult operating environment. With strong expense management and operational efficiency, profit from operations for these business units increased by 12% year on year.
Our Financial Services division developed and improved its offering through its flagship umbrella fund, which grew to more than 1 300 clients (up 16%) from the prior year.
Despite new business gains resulting in a 24% increase in gross annualised premium, the underwriting results from AF Life declined as a result of poor claims experience in the currently difficult economic climate where disability claims increased and rehabilitation tends to be more difficult.
Investment Solutions experienced higher-than-expected ongoing cash outflows primarily related to the decreasing employment rate in South Africa. In 2016, these outflows exceeded recurring cash inflows by R13.5 billion. Results were further depressed by an increasing trend of clients moving toward lower-cost investment options given the prevailing market environment. As a result, the entire investment and savings value chain has seen depressed margins in the South African market.
The institutional segment of the short-term insurance business has seen significant success for the year, with gross written premiums increasing by 55% to R67 million and profit from operations up 150%, albeit off a very small base.
Leveraging the core to grow (retail)
|
Operating income |
Profit from operations |
|||||
|
31 March |
Var. |
31 March |
31 March |
Var. |
31 March |
|
|
Retail business |
||||||
|
Financial Services |
615 |
8 |
569 |
207 |
12 |
185 |
|
Investment Solutions |
150 |
7 |
140 |
68 |
10 |
62 |
|
AFI |
431 |
9 |
394 |
108 |
14 |
95 |
|
1 196 |
8 |
1 103 |
383 |
12 |
342 |
|
Alexander Forbes made significant progress in developing and implementing its client-centric strategy during the year. Through an integrated approach we intend to deliver holistic solutions to the client.
Financial planning consultants delivered an 8% increase in the number of clients, ending the year with more than 46 000 clients (2015: 44 000). Assets under advisement grew by 9% over the year to R62.2 billion (2015: R56.9 billion) and assets under administration on our LISP platform grew by 8% to R52.2 billion (2015: R43.3 billion).
AF Life provides long-term insurance to individual clients. During the year, its focus on increased distribution channels and the launch of a new funeral policy resulted in a 61% increase in the number of policyholders.
Retail assets under management by Investment Solutions increased by 7% to R49.2 billion off the back of good cash flows from new business. This was off-set somewhat by the negative impact of volatile markets, increased withdrawals and annuity payments. Nevertheless, the business grew operating income and profit from retail by 7% and 10%, respectively.
AFI grew its gross written premium 11% to R1.4 billion in 2016. The business continues to grow ahead of competitors, based on an enhanced product offering and superior service. For more on its service and product commitment to clients, see 'Clients'. Unfortunately, a number of high-value weather-related claims had a detrimental effect on claims for the year, resulting in a loss ratio of 76% for the motor household business. While this was higher than the prior year (72%), it nevertheless remains within the long-term target range and work continues to ensure that the cost of claims is managed optimally and the pricing of the book is accurate.
AfriNet
|
Operating income |
Profit from operations |
|||||
|
31 March |
Var. |
31 March |
31 March |
Var. |
31 March |
|
|
AfriNet (Africa excluding SA) |
346 |
19 |
291 |
74 |
23 |
60 |
It is pleasing to note that East Africa and retail are now consistent and larger contributors to the overall AfriNet growth. From a geographical perspective, East Africa now contributes 23% of operating income and 14% of profit from operations, whilst southern Africa remains a dominant contributor with 74% of AfriNet’s operating income and 86% of its operating profit.
During the year, the business was characterised by organic growth and an increased focus on retail, leveraging off developments in South Africa. This approach is yielding positive results, with double-digit growth in operating income and profit.
Geographically diversified income from AF International
|
Operating income |
Profit from operations |
|||||
|
31 March |
Var. |
31 March |
31 March |
Var. |
31 March |
|
|
Total International (GBPm) |
90.6 |
8 |
84.2 |
13.7 |
11 |
12.3 |
|
Total International (Rm) |
1 886 |
26 |
1 495 |
286 |
31 |
219 |
The international business comprises the consulting actuarial business of Lane Clark & Peacock (LCP) with operations in the United Kingdom, Ireland and the Netherlands.
In 2016, the businesses continued to gain new clients, capitalising on the demand for employee benefit and actuarial consulting, investment consulting (including de-risking solutions) and general insurance actuarial consulting. Operating income and profit grew 8% and 11% in sterling, respectively, providing a rand hedge which benefited group results due to the 23% deterioration in the weighted average rand/sterling exchange rate over the year.
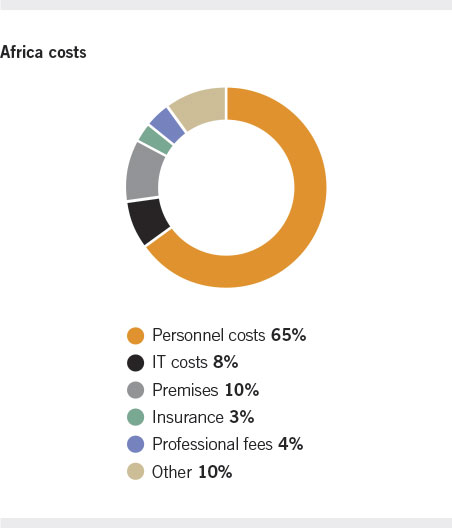
Controlling costs
Operating expenses
The basis of the group’s operating expenses is the costs of its people, technology, premises and insurance. In 2016, these costs collectively increased by 12% to R4.2 billion, largely due to the effect of the weakening exchange rate on the international costs. Despite this, and pressure to deliver on strategy implementation, cost discipline in the South African businesses was well managed during the year.
Service and operational excellence
The fourth ambition of our strategic intent – Strive for excellence – articulates our goal of achieving efficiencies through service and operational excellence. To this end, the group has formed two additional operational clusters:
The operations and technology cluster (OPTEC)
This cluster’s mandate is to hold accountability for the full operational and technology platform within Alexander Forbes. It includes:
- Managing a holistic digital strategy
- Managing all core operating systems
- Removing duplication and cutting out inefficiencies
- Driving a modernisation strategy to ensure core systems and technology remain relevant and 'future-proof'
The shared services cluster (Shared Services)
This cluster is mandated to improve operational efficiency related to back-office enablement. This covers both cost efficiency and optimisation, and includes:
- Re-engineering and automating organisational processes
- Reducing overhead costs
- Providing best-practice policies, controls and governance for all business management areas
Costs by segment
|
Operating expenses |
|||
|
Rm |
31 March |
% |
31 March |
|
Institutional cluster |
1 481 |
3 |
1 444 |
|
Financial Services |
1 104 |
4 |
1 066 |
|
Investment Solutions |
362 |
(2) |
368 |
|
AF Insurance |
15 |
50 |
10 |
|
Retail cluster |
813 |
7 |
761 |
|
Financial Services |
408 |
6 |
384 |
|
Investment Solutions |
82 |
5 |
78 |
|
AF Insurance |
323 |
8 |
299 |
|
AfriNet |
272 |
17 |
232 |
|
Total Africa |
2 566 |
5 |
2 437 |
|
International |
1 600 |
25 |
1 277 |
|
Total group |
4 166 |
12 |
3 714 |
Costs by type
As with most businesses in South Africa, the current economic environment has forced the group to cut back on planned investments. The balance between cost discipline and enabling the group’s strategic initiatives has been particularly challenging. Increasing regulatory requirements, particularly stemming from SAM, POPI, TCF and complaints management processes have contributed to cost increases.
Accounting for share-based payments
The group implemented a share-based long-term incentive (LTI) plan at the time of its 2014 listing. Prior to that date, management’s LTIs were ownership-based under the private equity arrangements. The new LTIs include equity-settled share-based payments that are accounted for in the expenses of the company as required by International Financial Reporting Standards (IFRS 2).
The costs included in the expense base are calculated based on a number of factors, including the number of shares, vesting period, share price at the allocation date and actual performance to date against the performance criteria. The cost included in the group’s 2016 results covering all incentives (including deferred transaction incentives from 2014) was R41 million (2015: R32 million). For more on Alexander Forbes’s approach to incentivising employee performance, see 'Remuneration'.
Maintaining investor confidence
The business continues to provide investors with positive organic growth in earnings and good cash conversion. For more detail on our proposition for investors, see 'Our investment case'.
Normalised profit
The group’s normalised results reflect the economic and legal substance of the group’s performance and are presented to reflect the basis upon which management manages the group. The adjustments between the IFRS summary consolidated income statement and the normalised results are as follows:
- Accounting for property lease – The accounting treatment for long-term leases, particularly at the Sandton head office, continues to have a small positive impact on the operating profit growth rate while the absolute value is an expense of R30 million of the year ended 31 March 2016.
- Capitalisation of intangible assets and the related amortisation – Non-trading and capital items include the ongoing accounting amortisation of intangible assets amounting to R124 million for 2016 and R131 million in the prior financial year. The capitalisation of intangible assets and the related amortisation resulted from the required accounting treatment at the time of the private equity acquisition of the group under common control in 2007.
- Accounting for Alexander Forbes shares held in policyholder investment portfolios – In terms of IFRS as presently constituted, any Alexander Forbes shares acquired by underlying asset managers and held by the group’s multi-manager investment subsidiary for policyholders (the shares) are required to be accounted for in Alexander Forbes’s consolidated financial statements as treasury shares and results in the elimination of any fair value gains or losses made on the shares.
- Investment income and taxation payable on behalf of policyholders – The group’s tax rate compared to profits before tax appears high as a result of taxation payable on behalf of policyholders being included in this amount (refer to the investment income discussion as well as note 8 in the full financial statements). The normalised results exclude the policyholder tax expense and the related investment income which directly off-set this tax expense.
Key risks
- South African economic recovery
- Ongoing margin pressure
- Achieving operational efficiency
- Evolving regulatory environment
Dividend
A dividend has been declared taking into account the group’s current and projected regulatory capital position. The group’s plans for increased capital expenditure will be funded from ongoing cash resources generated by operations. A dividend of 22 cents per share is payable to shareholders recorded on 19 July 2016.
The long-term dividend guidance for the group continues to be 2 to 1.5 times dividend cover.
Summary consolidated normalised results
For the year ended 31 March 2016
|
Rm |
2016 |
Lease |
Intan- |
Cell- |
Treasury |
Policy |
2016 |
% |
2015 |
|
Continuing operations |
|||||||||
|
Operating income net of direct expenses |
5 376 |
5 376 |
11 |
4 851 |
|||||
|
Operating expenses |
(4 166) |
30 |
(4 136) |
(3 674) |
|||||
|
Profit from operations before non-trading and capital items |
1 210 |
30 |
1 240 |
5 |
1 177 |
||||
|
Non-trading and capital items |
(137) |
124 |
9 |
(4) |
6 |
||||
|
Operating profit |
1 073 |
30 |
124 |
9 |
1 236 |
4 |
1 183 |
||
|
Investment income |
294 |
(197) |
97 |
123 |
|||||
|
Finance costs |
(71) |
(71) |
(119) |
||||||
|
Reported profit/(loss) arising from accounting for policyholder investments in treasury shares |
59 |
(59) |
– |
– |
|||||
|
Share of profit of associates (net of income tax) |
4 |
4 |
3 |
||||||
|
Profit before taxation |
1 359 |
30 |
124 |
9 |
(59) |
(197) |
1 266 |
6 |
1 190 |
|
Income tax expense |
(468) |
(8) |
(35) |
(2) |
197 |
(316) |
(340) |
||
|
Profit for the period from continuing operations |
891 |
22 |
89 |
7 |
(59) |
– |
950 |
12 |
850 |
|
Attributable to: |
|||||||||
|
Equity holders |
746 |
22 |
89 |
7 |
(59) |
– |
805 |
8 |
743 |
|
Non-controlling interest holders |
145 |
145 |
107 |
||||||
|
891 |
22 |
89 |
7 |
(59) |
– |
950 |
12 |
850 |
|
|
Headline earnings per share (cents) |
56.9 |
62.2 |
5 |
59.4 |
|||||
|
Weighted average number of shares in issue (millions) |
1 282 |
1 299 |
1 252 |
Looking ahead
The year has been challenging for Alexander Forbes’s executive management team as the South African business environment and economic fundamentals have negatively affected key business drivers and worked against our efforts to show traction on our strategic goals.
The group’s key focus will continue to align with our higher-purpose objectives set a number of years back: to create, grow and protect our clients’ wealth. In doing so, we help our clients achieve peace of mind through securing their financial well-being.
We remain confident that our strategic intent is sound however; and our focus in the coming year will remain on driving top-line growth while optimising operational expenses and ensuring organisational integrity.
As such, we will aim to:
- Improve asset capture in the institutional core business by providing tailored product options suited to clients’ needs; deepening our investment knowledge and enhancing investment performance; and by granting clients easier access to investment choices, including lower-cost investment portfolios
- Continue to access the institutional member base to provide appropriate holistic financial advice and relevant value-adding products to retail clients
- Use the expertise gained in South Africa to drive growth in the rest of the continent
- Drive modernisation in our technology environment including our digital interface with our clients
- Continue to challenge ourselves and find efficiencies in our operating environment


